

Weekly Metrics Digest
Your Weekly KPI Report, Waiting for You on Monday
PandaOS pulls last week's numbers from your database, charts them, and holds the digest in a new chat until you send it to the team.
 Your Keys
 Hot-Swap AI Plans
 No Data Training
 Desktop-First
The problem
Why the Weekly Report Is Always Late
The numbers live in the database, the chart gets made in a spreadsheet, and the summary gets written in an email. Every Monday someone repeats the same steps by hand, and when they are busy the report simply does not go out.
- The database
- A spreadsheet
- A chart
- A summary
- An email
How PandaOS Builds the Digest
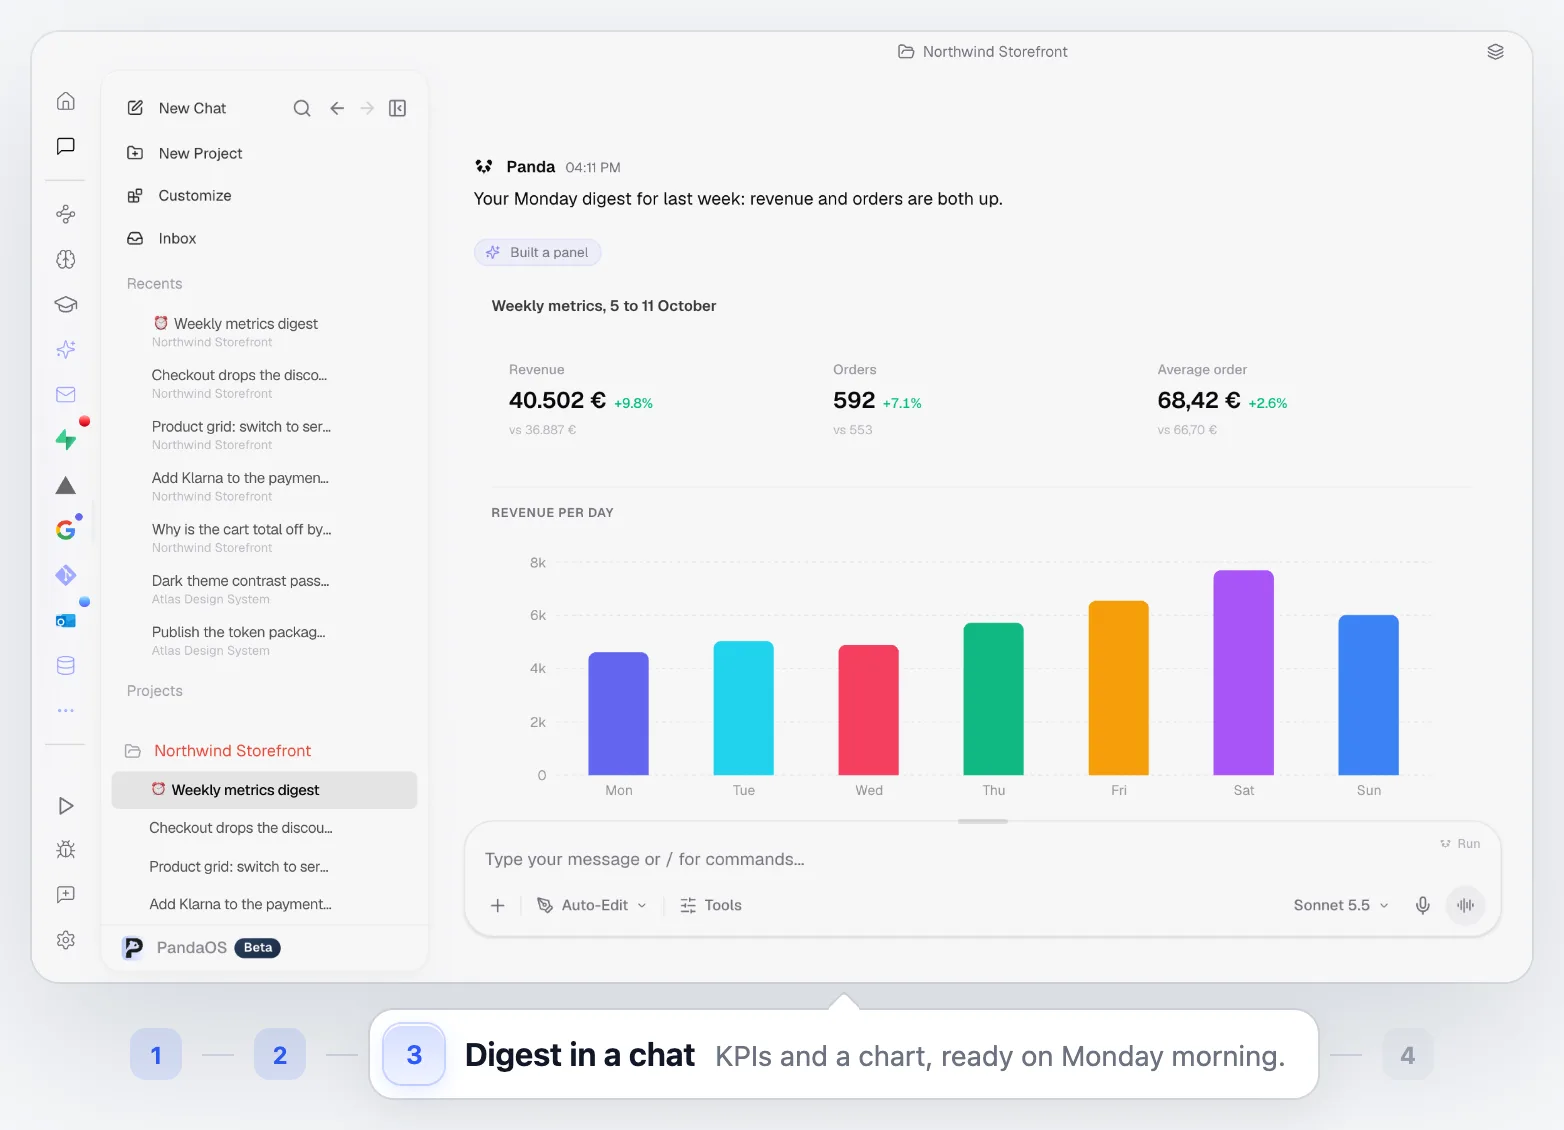
Each week is compared with the one before, so the digest leads with what moved instead of a wall of numbers.
Send this to the team.
- 01
Write One Prompt
Say which numbers matter and who should get them.
Chat - 02
Schedule It
Make it an Automation, so the weekly KPI report runs on a schedule every Monday morning.
Automations - 03
Query the Week
PandaOS queries your connected database for the period.
Database - 04
Chart What Changed
It charts the numbers and compares them with the week before.
Chat - 05
Write the Summary
A few lines on what moved and why it matters, above the chart.
Chat - 06
Send It to the Team
Ask for it in the chat: a Gmail draft opens for review, and you click Send.
Gmail
Best for Teams That Run on a Weekly Rhythm
When everyone should see the same numbers, at the same time, without asking.
Founder Updates
Revenue, orders and signups for the week, without building it yourself.
Team Check-Ins
Everyone walks into Monday's meeting having read the same numbers.
Investor and Client Reports
A recurring update that is ready on time, every time.
Early Warnings
Ask the digest to flag anything that dropped more than you expect.
Built Into the Rest of PandaOS
The parts of PandaOS this workflow runs on, each worth a look on its own.
Let Monday's Report Write Itself
One prompt, one schedule, and the whole team sees the week's numbers before the first meeting.
FAQ
Does it run when my laptop is closed?
Automations run while PandaOS is running. Closing the window keeps PandaOS in the menu bar, where the schedule still fires; quitting the app stops it until you open it again.
Which data sources can it use?
The database or Supabase project connected to the project. Ask in the prompt for the numbers you want, in plain words.
Will it email people without my approval?
Only if you allow it. Sending mail is an action you control per app: let it run, have PandaOS ask first, or keep it off and send the draft yourself.
Can I change what is in the report?
Yes. Edit the prompt: add a metric, change the period, or ask for a different chart. The next run follows it.
Can I just ask once instead of every week?
Yes. See the Analytics from Plain English use case: ask the question in a chat and get the chart right away.


