

Plain English Analytics
Ask Your Database in Plain English. Get a Dashboard.
PandaOS writes the SQL, checks with you before running it, and hands you a link the whole team can open.
 Your Keys
 Hot-Swap AI Plans
 No Data Training
 Desktop-First
The problem
Why Simple Questions Wait in a Queue
Most data questions are small: which products sold best, how this month compares to last. But answering one means knowing the schema, writing SQL, exporting results, building a chart and pasting it somewhere. So the question waits for whoever has the time.
- The question
- The schema
- The SQL
- A chart
- A dashboard
- Someone to send it to
How PandaOS Answers It
From the question to a shared answer, without leaving the chat you asked in.
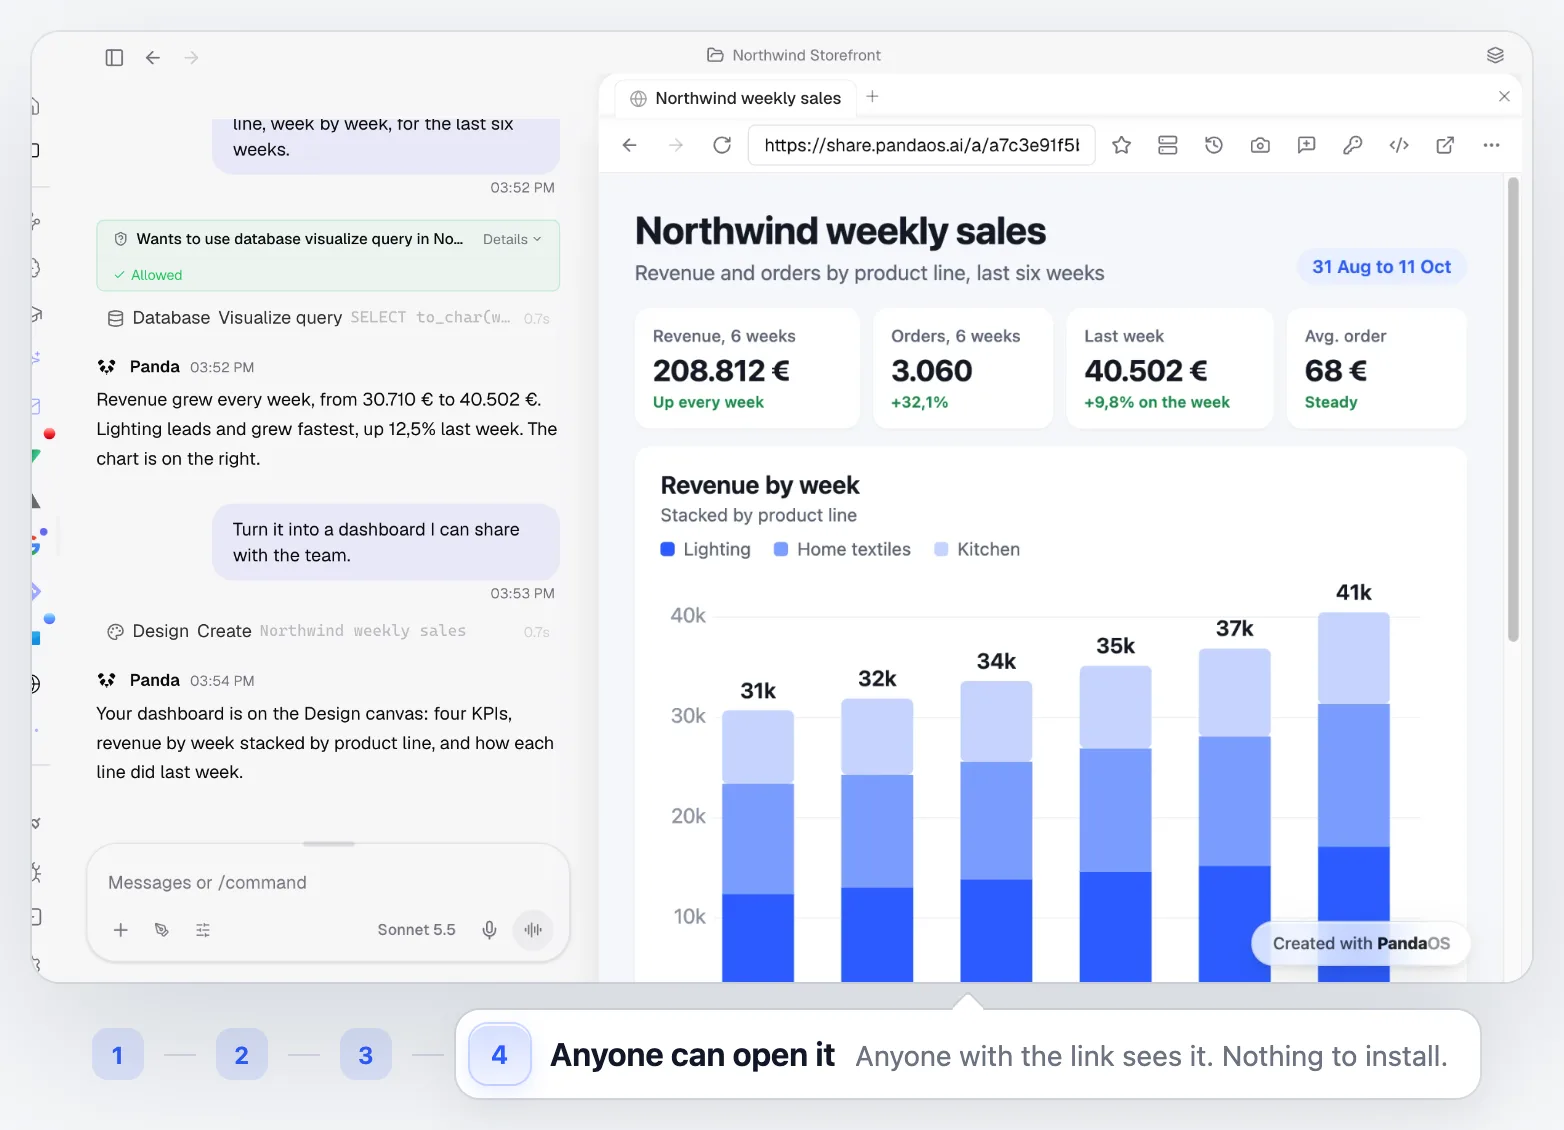
Show revenue and orders by product line, week by week, for the last six weeks. Then turn it into a dashboard I can share with the team.
- 01
Connect the Database
Link your database or Supabase project to the project you work in, once.
DatabaseSupabase - 02
Ask in Words
Ask your database in plain English, the way you would say it. No SQL, no table names needed.
Chat - 03
PandaOS Writes the Query
Text to SQL that shows its work: it reads the schema, writes the SQL query and asks before it runs, so you see exactly what touches your data.
Database - 04
See the Chart
The result opens in the database panel as a chart, beside the chat.
Database - 05
Build the Dashboard
The Design tool lays the answer out as one page: KPIs, trends and what changed.
Design - 06
Share the Link
One click publishes a view-only link. Anyone with it sees the dashboard in a browser, nothing to install.
Design
Best for Questions That Should Not Need a Ticket
When the answer is in your database and the only thing missing is the query.
Founders Checking the Numbers
Revenue, signups and top products, on demand, without opening a BI tool.
Product Questions
Which feature is used, by whom, and since when, asked in the middle of building it.
Follow-Up Questions
Ask the next question in the same chat. PandaOS keeps the context of the last one.
Answers for Someone Else
Turn a colleague's question into a shareable dashboard built from your database, sent as a link.
Built Into the Rest of PandaOS
The parts of PandaOS this workflow runs on, each worth a look on its own.
Stop Waiting for the Query
Connect your data once and ask it anything, in words, from the same workspace where the work happens.
FAQ
Which databases can PandaOS query?
PandaOS connects to databases through its Database app and to Supabase projects. Connect one to a project and PandaOS can read its schema and run queries there.
Do I need to know SQL?
No. Ask in plain words. PandaOS writes the query, and you can read exactly what ran if you want to check it.
Can PandaOS change my data?
Only if you allow it. Every connected app has per-action controls, so writes can ask you first or stay switched off while reads run on their own.
Can I ask a follow-up question?
Yes. Ask in the same chat, for example to compare with the previous period, and PandaOS builds on the last query.
Can this run on a schedule?
Yes. Turn the question into an Automation and the chart is ready every week. See the Weekly Metrics Digest use case.


